About Me
My name is Bryce Moskiewicz, I’m currently a Software Development Engineer for AWS with prior experience at U.S. Steel. I am also a former Division 1 athlete.
Projects
Feel free to check them out! If you have any questions about these projects please contact me with the information below.
Snake AI
The AI model on the left works by finding the shortest path to the red pixel possible which sometimes leads to it trapping iteself and dying. The AI model on the right works by following a closed loop which covers every cell respectively. The latter of the two is guaranteed to win no matter what even though it may take a long time.
Smart Mirror
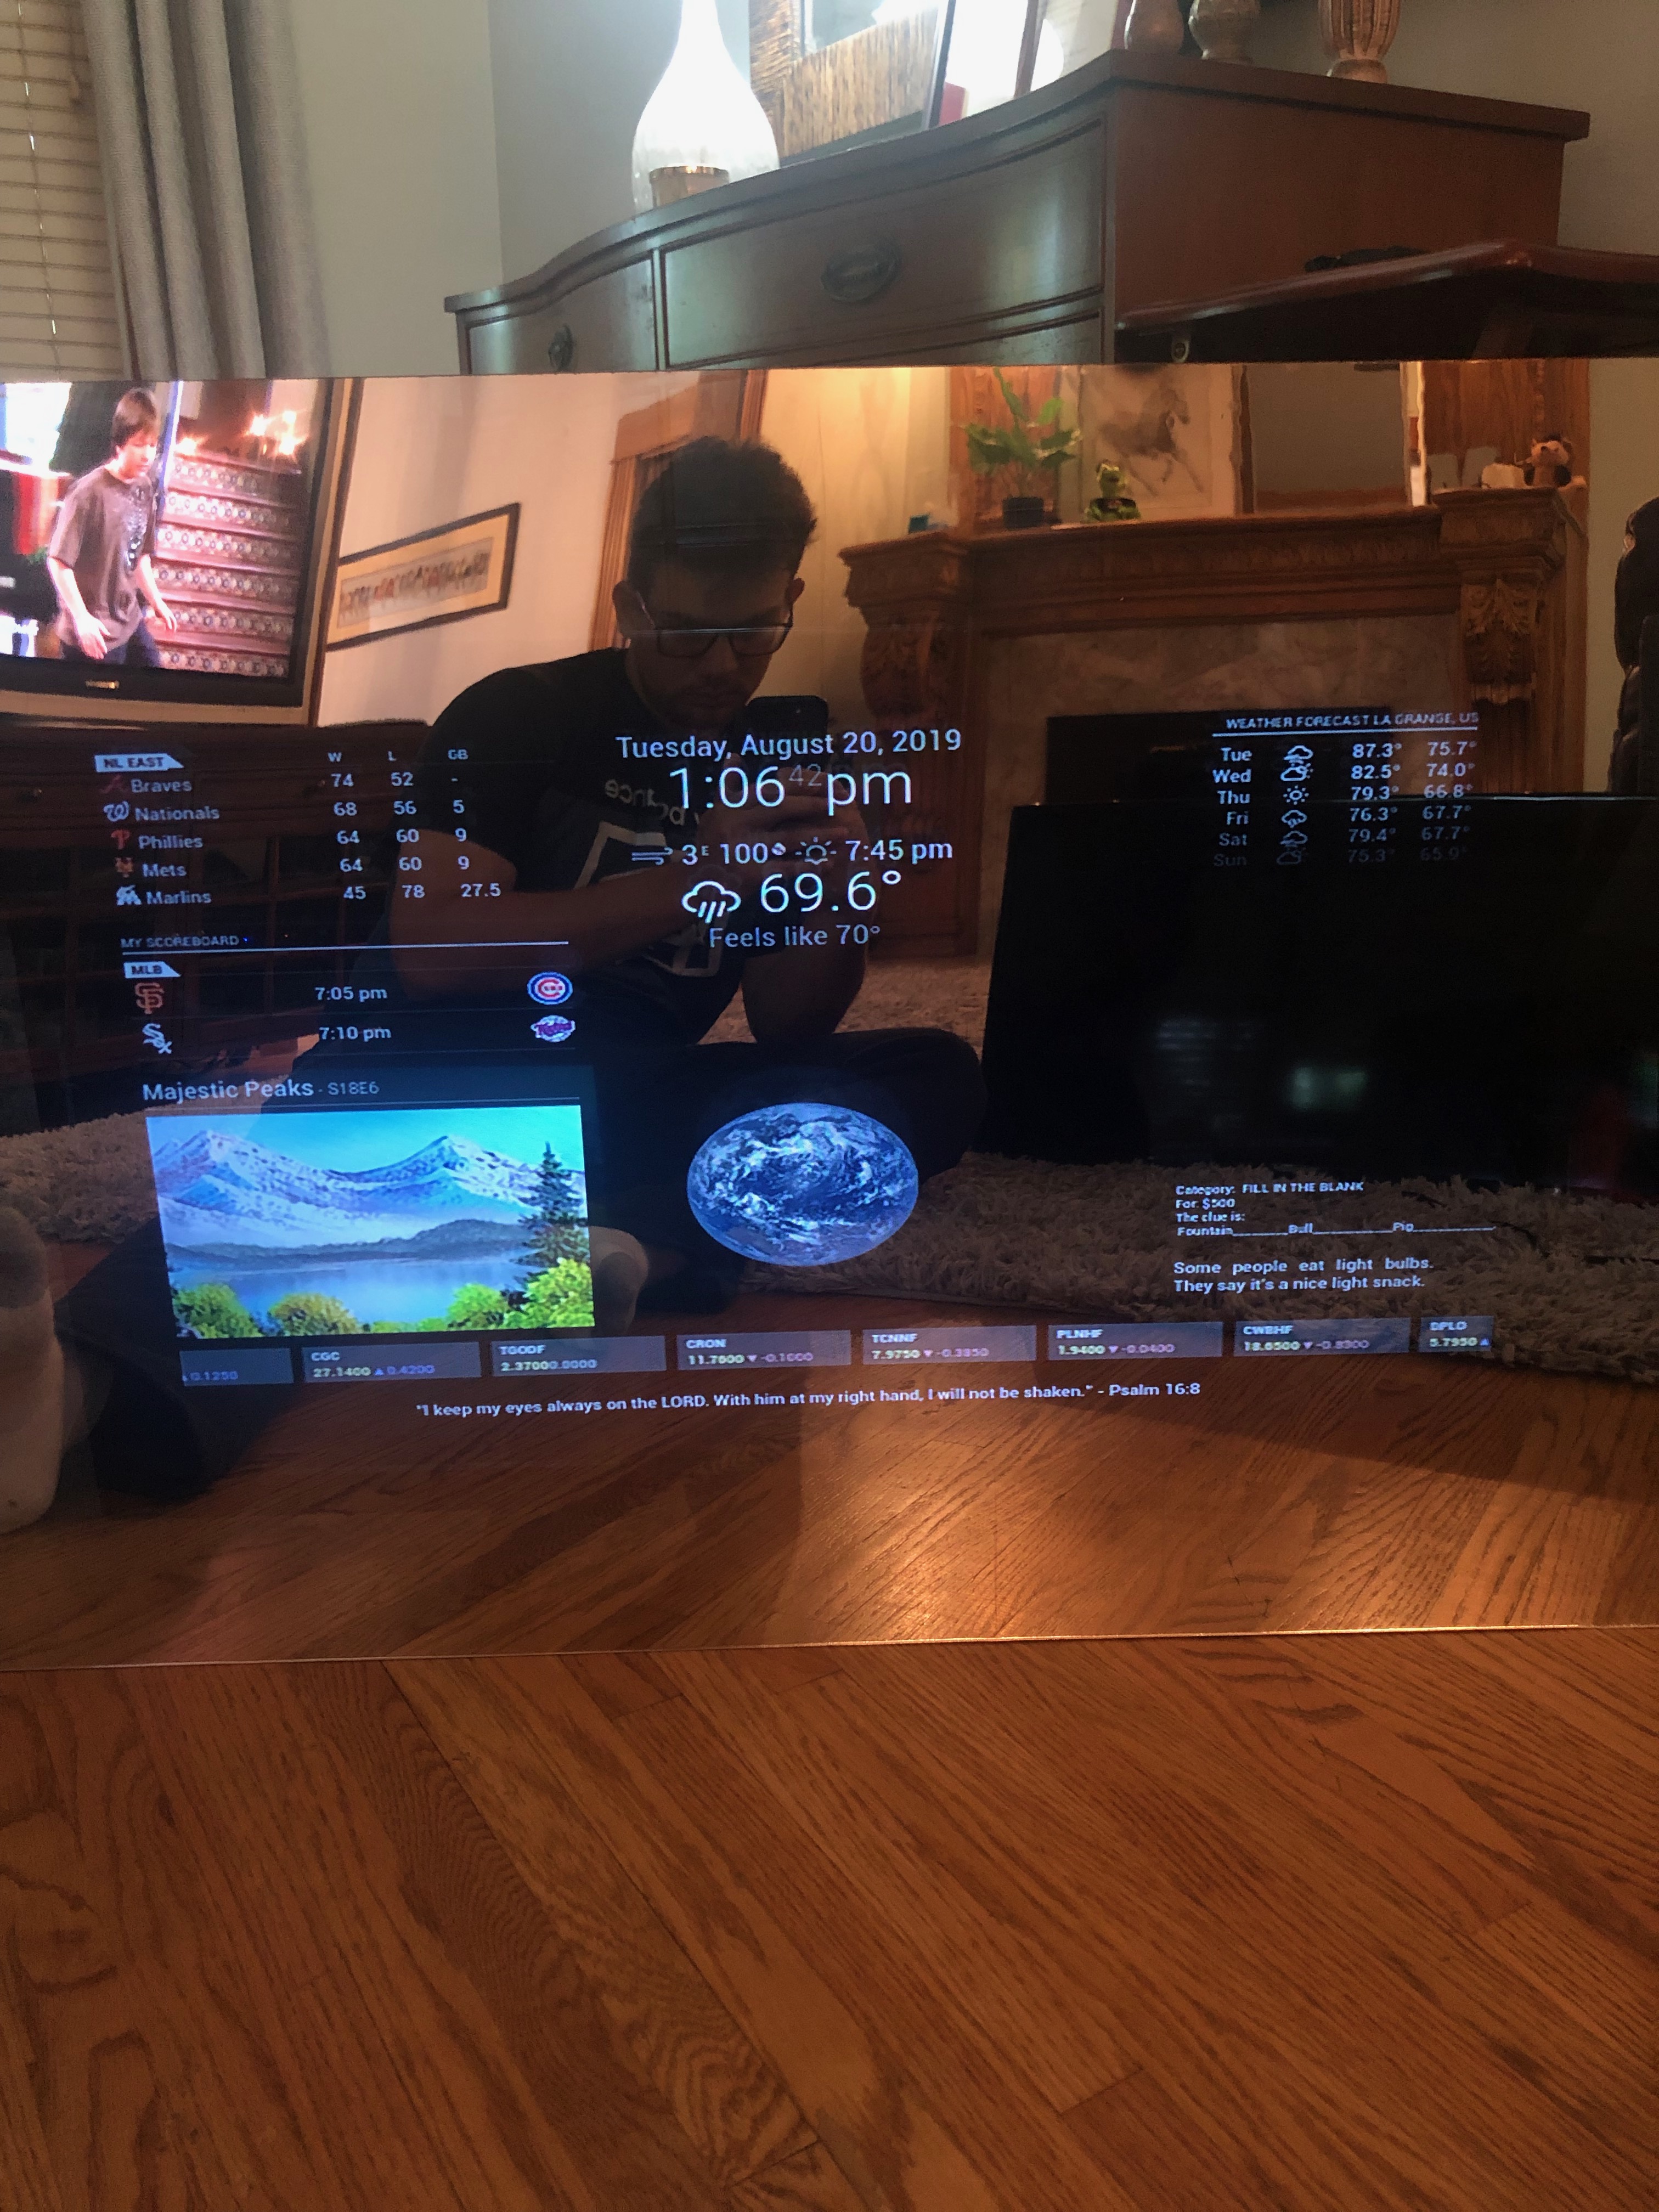
A Smart Mirror is a mirror which displays helpful widgets for you to see and interact with while you are getting ready to leave your house for the day. My specific Smart Mirror is configured to display Time, Date, Sports Scores and Standings, Weather, Stock Tickers, Bob Ross Paintings, as well as daily Jeopardy questions. I also was able to outfit the Smart Mirror with a 'remote control' phone app which allows you to control the display of the mirror.
This project involved the use of a Raspberry Pi, a piece of acrylic glass, and a display for the Raspberry Pi to connect with. The finished product can be seen above, and is still used every day in my home. (The picture on the left is of my build while the video on the right is not mine, but is intended to give a clearer picture of the project).
Conway's Game of Life
This is merely a demonstration of the game and is not the code used for my group project. If you are interested in the source code my group created for this project, I have included it here.
Conway's Game of Life is a cellular simulation which has an end state only effected by the initial state of the game. In other words, it's a grid simulation that is entirely based off of its starting point. The game revolves around giving the program an initial amount of alive and dead cells, and then watching the cells change according to these four rules:
- Any live cell with fewer than two live neighbors dies, as if by underpopulation.
- Any live cell with two or three live neighbors lives on to the next generation.
- Any live cell with more than three live neighbors dies, as if by overpopulation.
- Any dead cell with exactly three live neighbors becomes a live cell, as if by reproduction.
Machine Learning Applied to the S&P 500
.png)
I have included the code I created for this project here.
For this project, I wanted to study the effects of a recession or depression on the short term future of the economy. To accompany this analysis, I created a model which predicts the likelyhood of different percentage increases for the S&P 500 following those recessionary and depressionary time periods based off of how severe those recessionary and depressionary time periods were.
I took a look at historical data for the S&P 500, and picked out a variety of points which followed a decrease of 10% or more for the S&P 500. I then looked ahead 1 year and input a '1' into a Neural Network if the price had risen by atleast 25%, otherwise I put in a '0'. I also looked ahead 5 years and input a '1' into a Neural Network if the price had risen by atleast 50%, otherwise I put in a '0'.
I then plotted the corresponding outputs of the Neural Network to the left. What I had found is that the greater the stock market decreases in price over a period of time, the higher the likelyhood that the stock market will increase by atleast 25% in 1 year, and atleast 50% in 5 years. To generalize this conclusion, it is essentially saying that the more the market decreases over a period of time, the more likely the market is to increase in the near future. this finding was unsurprising to me, but further emphasized for myself not to panic when the market decreases in value.
To accomplish this project I used javascript as well as the Brain.js and Plotly.js libraries. Brain.js was used for their Neural Network feature, while Plotly.js was used for their plotting features.